By Maxmillion Kenny, Samuel Ploskonka, Rosa Beghi, Jazmin Cevallos Vintimilla & Victoria Van der Haegen
Spending two weeks in the Ndumo Game Reserve as part of the Living Lab was for all of us an amazing learning experience. By being part of the abiotic water group, we conducted research on different abiotic variables of water samples to investigate the correlation of land use and water quality of the floodplain basin of the Ndumo Game Reserve. It was a thrilling rollercoaster ride to sample water bodies under the scorching sun while being on guard for hippos or crocodiles, but cool days like these don’t happen too often in life and the perks outbalance the cons. Overall, being surrounded by nature the entire day – even during the car rides you can spot wildlife too – was definitely the best thing about fieldwork.
For the sampling part of our research, we got the chance to measure in-situ the abiotic variables such as pH, chlorophyll-A, phycocyanin, conductivity, etc. in different water bodies – that ranged from temporarily pans, permanent pans, and rivers (such as the Usuthu and the Phongolo) – by using a calibrated stick, a Hanna multimeter, a fluorometer and an acrylic tube. Among the different land uses we noticed that nature, agriculture, fishing, washing, and health care are all different ways in which the water bodies were used. Back in the camp, the water samples were analyzed with a spectrophotometer in a set up laboratory in a caravan. All the results, from both in- and ex-situ observations, were bundled together in a huge excel so we could analyze it to answer our research questions.
What did we find out? Among the most important findings, we observed that all floodplains were more turbid and had a higher nutrient load than rivers. This makes sense, because of the intrinsic nature of the different water bodies. However, we also found important differences among the rivers, as well as among the floodplains. For example, Phongolo river was more turbid than the Usuthu river. This was mainly due to its bigger size and the higher amount of nutrient inputs that it receives. Likewise, we found more human activities associated with Phongolo river, which also affects indirectly to the water quality.
We also found out that Nyamiti pan had exceptionally higher levels of turbidity, salinity and nitrogen than the other pans. This might be mostly due to the geological history of this site, since it is located in a patch of saline marine sediments.
Regarding the nutrient concentration, we found an interesting contrasting pattern both in the rivers and floodplains. The water bodies with higher nutrient concentration, such as nitrogen and phosphorus, had lower amounts of photosynthetic pigments. This would be most likely because phytoplankton were constantly transforming nutrients into other complex biomolecules, such as chlorophyll and phycocyanin.
Assessing the abiotic features of the water bodies in the living lab was an extraordinary experience. We learned that ecological patterns don’t always behave in a predictable way according to literature. The environmental stochastic provides a never-ending source of variability, which might make the efforts of analyzing and understanding the results more difficult. However, it is still possible to disentangle certain patterns and understand the huge complexity and vulnerability of the socio-ecologic system we visited.
Water is a vital resource for people in the Ndumo region as well as for all the other life forms. Understanding better the dynamic of the different water bodies will be crucial for developing an equitable and environmentally friendly management of the water bodies. Nevertheless, a lot of research and social participation still needs to be done to achieve this. We are enormously thankful to all the organization team and the local communities with which we have interacted along this journey.
Siyabonga!
Victoria, Max, Samuel, Rosa & Jazmin
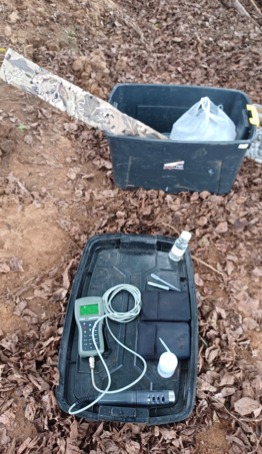
Materials to measure abiotic variables in the field: Abiotic group LL22 © SUSDEV
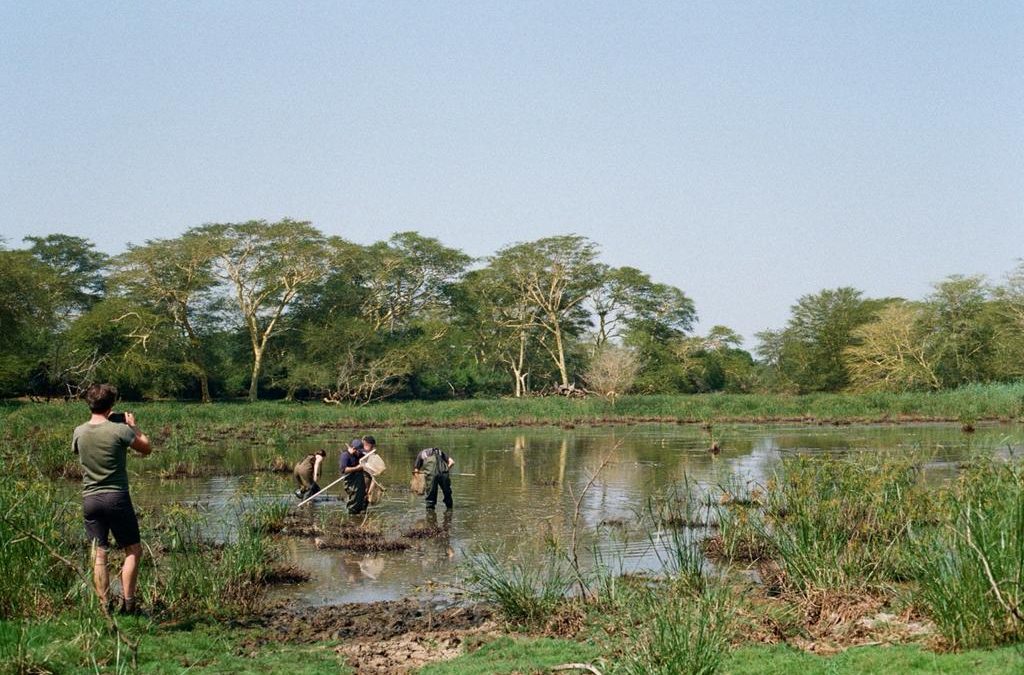
Sampling Site 1: Abiotic group LL22 © SUSDEV
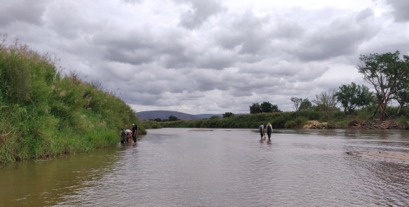
Sampling site 5: Abiotic group LL22 © SUSDEV
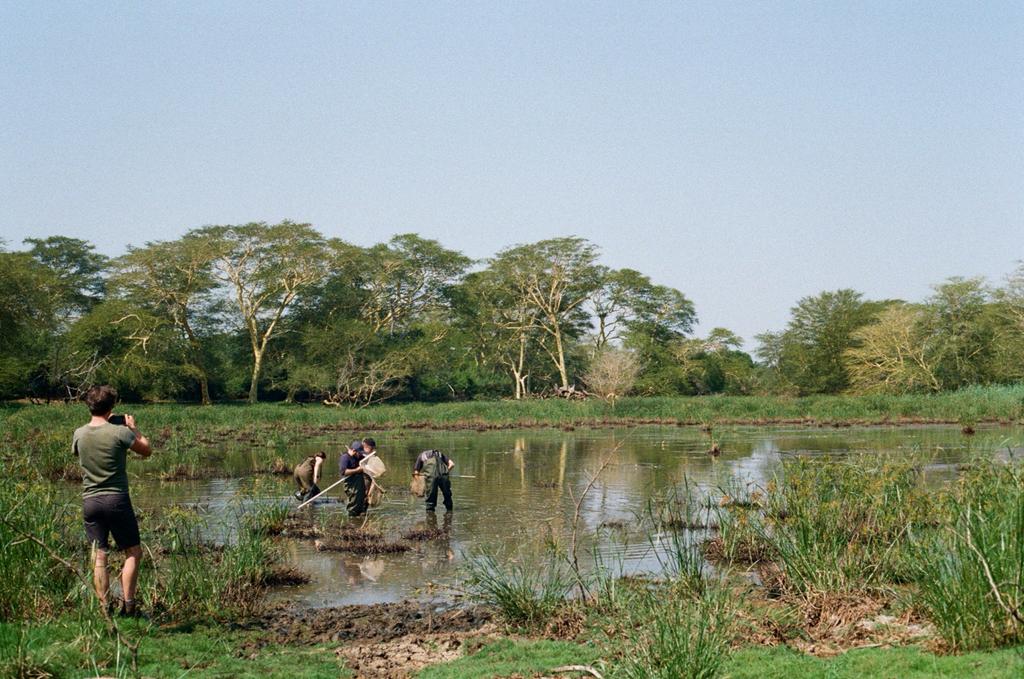
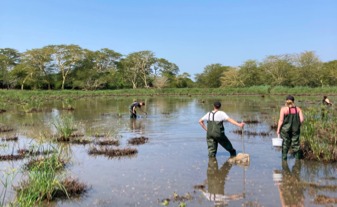
Sampling site 3: Abiotic group LL22 © SUSDEV
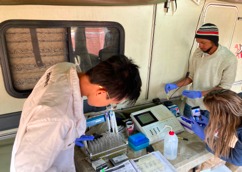
Spectrophotometer to measure the nutrient concentration from the samplings: Abiotic group LL22 © SUSDEV
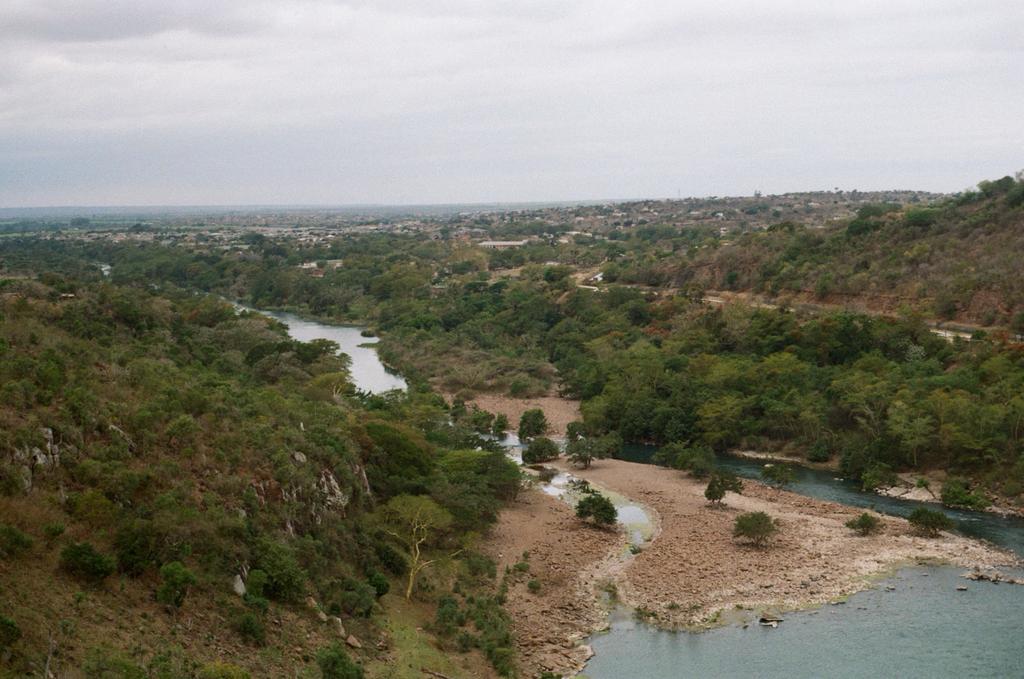
View from the Phongolo dam: Abiotic group LL22 © SUSDEV